Spark Core Freezer Monitoring Success
Monday, 03 February 2014
After installing the Spark Core as a freezer monitor last night, I ran curl in a while loop in bash to pull the temperature reading every minute overnight and append the results to a text file. This morning, after a little bit of sed and grep tweaking, I pulled the readings into Numbers and charted them:
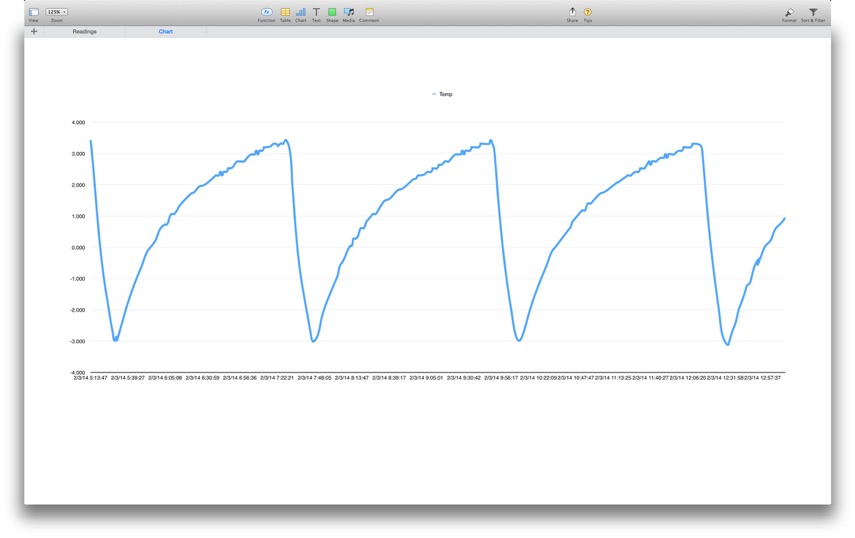
You can see that the temperature rises to around 3℉. The compressor then kicks in and lowers the temperature to around −3℉. The temperature then slowly rises up to around 3℉ again, and so on — illustrating the hysteresis of the temperature control system in the freezer.
I wrote a Python script to automate the process of grabbing the result, parsing the JSON and adding the result to the table being charted in the spreadsheet:
This isn’t particularly practical, but was interesting to see nonetheless. My main goal is monitoring, so I will drop the charting part in favour of a simple notification to my phone via Prowl.app when the temperature gets too high.